1 Diagrams Drift from Code
Your architecture diagram says "pending records are created when an order
converts to invoice." But it doesn't say where.
Is it flow.py? order_to_invoice.py? Line 332 or 171?
You grep. You find six creation sites across three files. Next month someone refactors and the diagram is wrong again.
CodeMap fixes this. The diagram links directly to
order_to_invoice.py:332. When code moves, update one JSON file
and regenerate. The diagram is always right because it reads the mapping.
Before

After

2 Three Layers, One Source of Truth
One JSON mapping file — codemap.json — powers everything.
Edit it once. All three layers update.
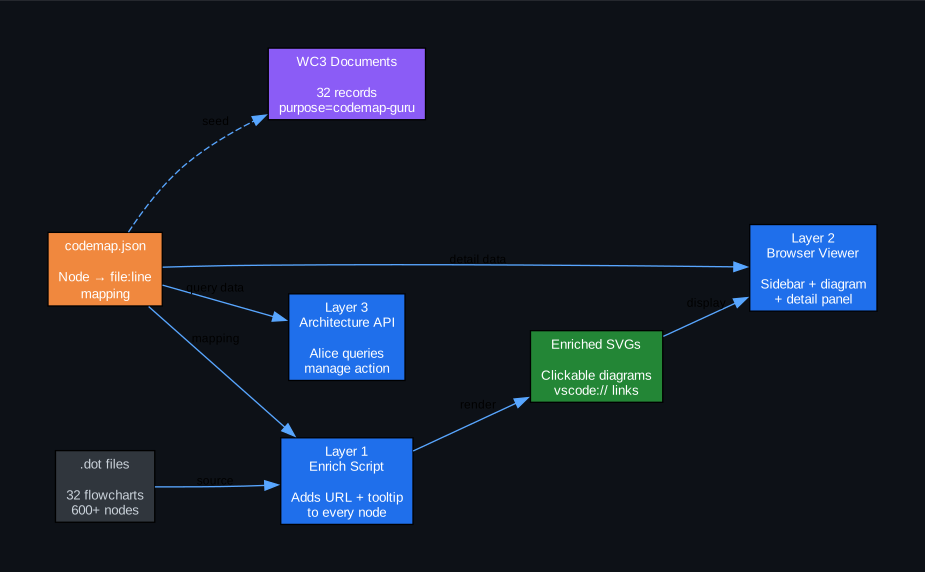
codemap.json is the single source of truth for all three consumers
Layer 1: Enrich
Python script reads .dot + codemap.json.
Adds URL and tooltip attributes to every mapped node.
Graphviz renders clickable SVG — clicking opens VS Code at the right line.
Idempotent. Run anytime.
Layer 2: View
Browser-based viewer with a sidebar listing all flowcharts and their coverage counts. Click any node — a detail panel slides in showing functions, file:line links, pending deltas, GL impact, and schema fields.
Layer 3: API
Three manage actions: get_architecture_node (with fuzzy matching),
get_architecture_map, and list_architecture_flowcharts.
Alice uses these to answer architecture questions by walking the graph.
3 Click a Node, See the Code
Every mapped node shows its full code context. Functions with file:line that open in VS Code. Pending deltas color-coded — green increases, red decreases. Code gaps flagged in yellow so you know what's missing before it becomes a bug.
pending
Central hub for inventory quantity deltas. All quantity changes flow through Pending before updating Item.
purchase
Purchase order to vendor.
Pending.objects.create writes +on_po. Receipt writes -on_po
on arrival, but nothing incremented it. CodeMap surfaced this automatically
— the node has no function link for the +on_po delta.
4 Gaps Surface Automatically
When a diagram shows a flow but the mapping has no code for it, that's a gap. CodeMap flags it. You fix it before customers find it.
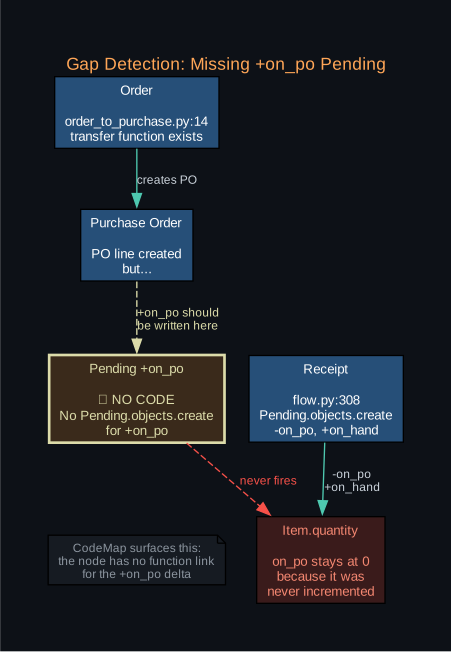
The +on_po pending record was never implemented — CodeMap found it by mapping diagram nodes to code
5 Live Example: Inventory Buckets
This is the actual enriched SVG from the WC3 codebase. 14 of 16 nodes mapped to code — 87.5% coverage. Hover any node for tooltips showing file:line and function context.
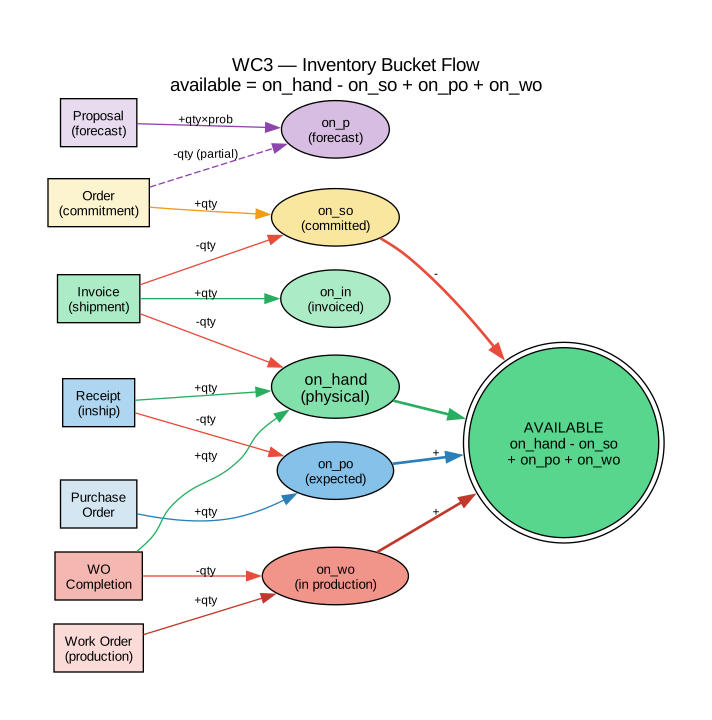
wc3-inventory-buckets — available = on_hand - on_so + on_po + on_wo
And the Big 4 Transactions — the core transaction lifecycle with line quantity fields and pending inventory flow. 16 of 19 nodes mapped (84%).
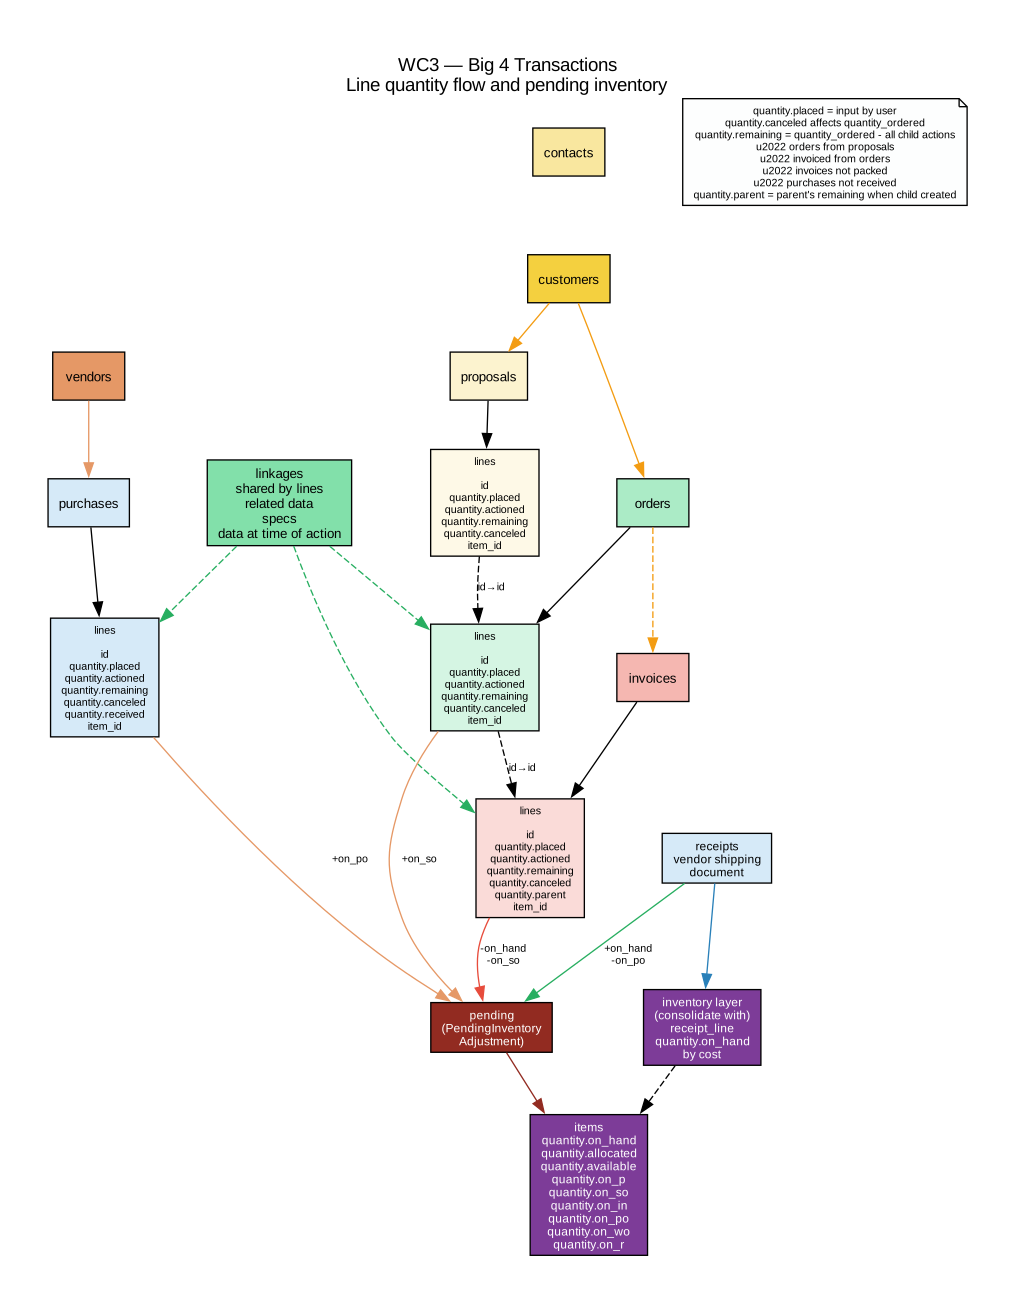
wc3-big4-transactions — line quantity flow and pending inventory
6 How to Use
Enrich all flowcharts and render SVGs:
# Reads codemap.json, adds URL/tooltip to .dot files, renders SVG
python3 scripts/codemap_enrich.py --all --render
Open the interactive viewer:
# Serves on localhost:8787, opens your browser
python3 scripts/codemap_serve.py
Query via API (Alice uses this):
# Get a specific node
POST /wcapi/manage/
{ "action": "get_architecture_node",
  "params": { "node": "pending" } }

# Fuzzy matching — returns all three journalize functions
{ "action": "get_architecture_node",
  "params": { "node": "journal" } }

# All mapped nodes in a flowchart
{ "action": "get_architecture_map",
  "params": { "flowchart": "wc3-inventory-buckets" } }

# Coverage report for all flowcharts
{ "action": "list_architecture_flowcharts",
  "params": {} }
Update the mapping and sync:
# 1. Edit the single source of truth
readmes/flowcharts/codemap.json

# 2. Re-enrich all flowcharts
python3 scripts/codemap_enrich.py --all --render

# 3. Update WC3 Document records + revision headers
python3 scripts/codemap_seed_documents.py --apply
7 Current Coverage
Every flowchart has a Document record in WC3 with
purpose="codemap-guru", tracking revision number, node count,
and coverage percentage. The mapping grows as nodes are added to
codemap.json — coverage increases automatically on
the next enrichment run.
8 Flowchart Library
32 architecture diagrams — click any card to view the interactive SVG with clickable code links and tooltips.
Core Transactions (8)

Master Flow 5 nodes
Complete transaction lifecycle — proposals through fulfillment and GL posting

Big 4 Transactions 16 nodes
Proposals, orders, invoices, purchases — the four transaction types and their relationships

Order to Invoice 3 nodes
The fulfillment pipeline — order lines become invoice lines, pending records move inventory

Inventory Buckets 16 nodes
How quantity flows: on_hand, allocated, available, on_so, on_po, on_wo, on_in, on_r

Pending Records
The central hub — every inventory change flows through Pending before updating Item

Payment & GL 1 node
Cash application, journal entries, AR/AP posting

PO/SO Bundle
Purchase order and sales order bundling flow

Statement Sorter 5 nodes
Bank CSV → classify business/personal → export → Payment.expense → GL journal entry
Products & Serial (3)

Products & Items 2 nodes
Item model, quantity JSON, inventory layers, costing

Serial Tracking 7 nodes
Serial number lifecycle — assignment, transfer, warranty, return

Serial Actions 1 node
Serial-specific actions and audit trail
Contacts & Sales (3)

Contacts 2 nodes
Central identity — customers, vendors, employees, prospects

Customer-Centered Sales 5 nodes
Sales flow from customer perspective — proposals, orders, fulfillment

Sign-in & Register
Authentication flow — registration, login, password reset
Connections (10)

Accounting
GL export, journal sync, chart of accounts mapping

Banking 1 node
Bank feeds, reconciliation, payment processing

Calendar
Event scheduling, appointment sync

Communication
Email, SMS, notification dispatch

Deployment
CI/CD, code deploy, environment management

Identity
SSO, OAuth, CarryOn identity integration

Internal
Inter-database sync, WC_HQ coordination

Payment 1 node
Payment gateway integration — Stripe, Square, etc.

Shipping 2 nodes
Carrier integration — rates, labels, tracking

Tax 1 node
Tax engine integration — jurisdiction, rates, exemptions
Projects & QA (4)

Projects 7 nodes
Project management — actions, documents, assigned contacts

Actions 2 nodes
Action tracking — tasks, approvals, escalation

QA Entity 3 nodes
Quality assurance — inspection, compliance, certification

Refs & Linkage 3 nodes
Cross-record references, shared line data, specs
Data & Infrastructure (5)

Data Conversion 1 node
CSV/Excel import — Alice maps columns, multi-pass, bundle output

Document Library
File management, versioning, access control

Exchange Rates
Multi-currency support — rate sources, conversion, history

Request Security
Request pipeline — authentication, RBAC, query scoping

Celery Pipeline
Background task processing — workers, beat scheduling, retry